Pages

Search This Blog

Sunday, August 26, 2018

Investing by the Numbers (Book Value)

It would be pretty interesting to select 10 stocks, based on a few parameters and see how they fare in 6 months, 1 year, and then 2 years from now.

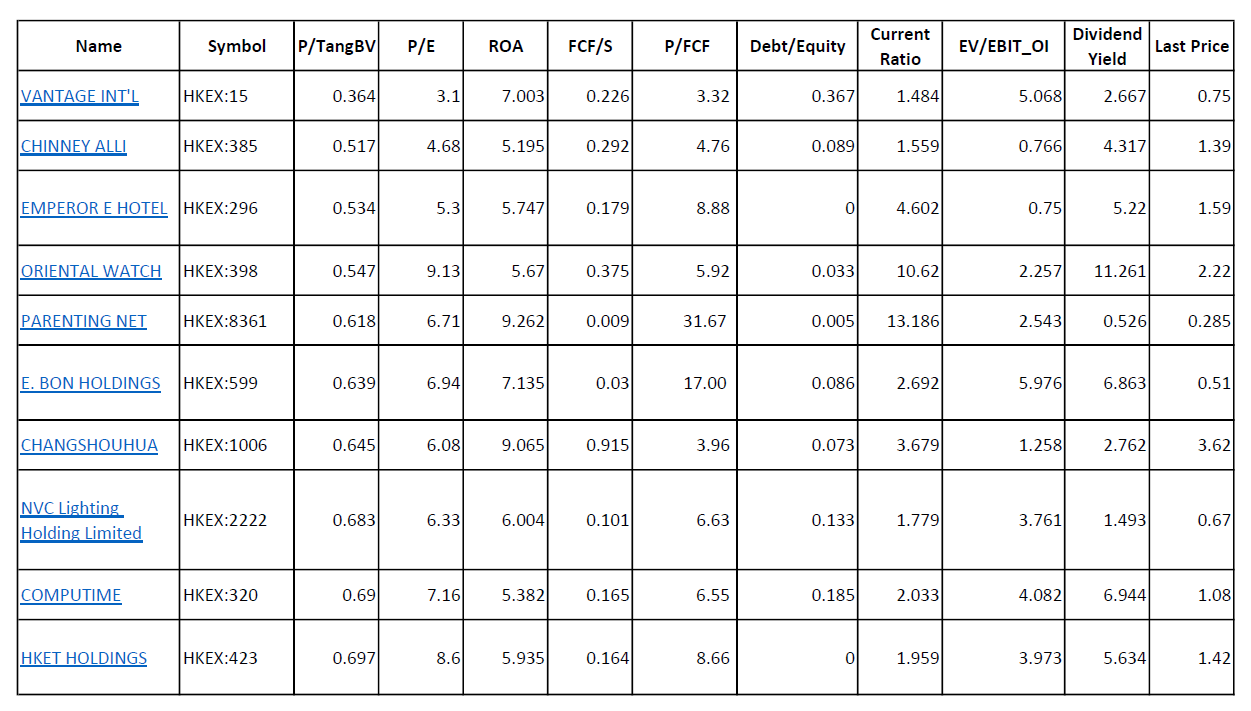
These stocks have the following:
a) a book value of less than 70 cents to a dollar
b) less than 50 cents of debt for every 1 dollar of equity
c) less than 8 times of operating income compared to its enterprise value (market cap - cash + debt).
d) current ratio > 1.5

The following stocks were generated by stock.cafe, and are pure HKEX plays. I think dividends should be taken into account. Can these stocks beat the index (Hang Seng Index).


As of now, the Hang Seng Index stands at 28,232.99 points. We will explore the results next year 27-Feb-2019.


Recommend Books Part Two (Essential Readings)

Leading up to the third anniversary of my investing journey, I think an update on recommended study materials is appropriate.

I am still a firm believer of self studying. Investing is not just financial rewarding but intellectually stimulating-- a perpetual treasure hunt.

1. The 5 Rules to Successful Stock Investing
There is not a better book out there (afaik) that explains the financial statements using the simplest of examples: running a hot dog stand. If you know nothing about reading simple accounting stuff, get this book. It will probably take you half a month to finish half of this book.


2. The Intelligent Investor
The writing style and examples used in the text isn't contemporary, but even reading the summaries written by Jason Zweig (latest edition in 2006 covered the melt down in tech meltdown in 2000) will help prevent losses.

As a value investor, we should check the downside and risks instead of the upside-- losing money is often easier than winning.

3. One Up on Wall Street
While this book can serve as a wonderful introduction to investing, it appeals to investors with slight investing experience (such as myself) with little gems like market timing (or why it shouldn't bother you), portfolio management, story checking, etc. Peter Lynch's classification of companies into six different categories is popularly used in the investment circle.

You might be keen on "Beating the Street" by the same author as well.

4. Financial Shenanigans
There are a million and one way for management to commit frauds. One should do one's best to check the numbers... This book will help.

5. You Can be a Stock Market Genius
While it lacks a serious title, this book changes the way I look at unconventional investment opportunities. If you are a fan of the Buffett Partnership, its investments were classified into three categories: Generals, Controls and Workouts. General refers to companies which are undervalued by the market, and after buying enough shares available to control the company, they become part of the Controls group.

The last section, called Workouts, refer to investments which does not move with the general market direction. These are special situations (as termed in book #2) which no doubt lower investment portfolio during a bull market, but greatly provide relief during a bear one. This book deals with Workouts, but even if your portfolio consist mostly of it, it will provide highly satisfying returns.

The same author wrote this book call "The Little Book that still Beats the Market." Another highly entertaining book as well.

6. The Dhando Investor
If you are determined to be a value investor, this book could be priceless. What is the difference between risk and uncertainty?

That is all. You will spend an approximate six months to a year reading all of the above, but re-reading them is not only necessary, but entertaining.

Thursday, August 23, 2018

Complete Divestment of Playmate Holdings; Rethinking my approach

I have divested my shares in Playmates Holdings (HKEX: 635). Over the months since Jan, I am slightly worried about a few points of this company:
a) Lower occupancy of investment property. It is noted that the company seems to have an attraction to Savills, having it being the property manager and the property surveyor. AFAIK, their method of valuation is level 3, which is worrying because the increase in value of its properties looks like a bubble in itself.

b) Reducing earning ability of its main toy business. I am not enamored of the quality of its upcoming toys as well. 

c) Slight increase in non-current loans for no reason despite its reasonably high cash position. I note that interest coverage this half is still a safe 20 times or so-- but why incur unnecessary debt?

d) Share buy backs using company's fund is encouraging but I rather the directors buy it using their own pocket and try to improve business.

e) I noted that the investment portfolio has increased by 40-50m or so, but there is no explanation for how they pick stocks, or who is managing their investments. Active investing is not easy-- especially with large money.

Overall gain in investment for Playmates, inclusive of the recent special dividends, is only 10%. This means I sold at break even price.

Moving on, I would like to share some opinions on retail investing.

Walter Schloss is my idol and I still find investing in his way the easiest. His returns might not be the highest, but investing is not about topping the class-- it is about getting decent returns over long period of time. I do think that if you end up in the top 25% of the investing community every year over long period of time (10 years), the results would be lovely. 

However, buying a small position over many companies requires a full time job. After reading The Dhandho Investor, I feel the practical method is to buy when you have ascertain a huge opportunity, and bet heavily. I think 8 is enough for diversification. 

In addition, the age-old belief in value investing is that you either buy a so-so company at a cheap price, or a great company at a fair price. Over time, I do think that the latter approach is easier. It is definitely easier to spot a company when it is cheap. If I have a sizable (400k-1m) amount of money to work with, leaving 50% of it for cheap companies is plausible. With the amount of money I have, I do need to rethink my approach to compound it efficiently.


Wednesday, August 15, 2018

Portfolio Commentary: August.

The market has been terribly kind to me lately, and I feel embarrassed as I witness other investors' portfolio get smashed pretty bad. I perceive some of them to be better investors really, so I guess Lady Luck has something to do with it.

As of writing, portfolio returned 18.98%, versus a -2.04%. This lead of 21% over the index is unprecedented.


Transactions made since the last update included:

(a) Complete divestment of Wheelock Properties. While it was a low ball offer, it makes little difference if the price offered is 2.4 or 2.2. I was waiting for 2.3 but it meant very little difference to me. Gains, largely due to luck, is about 40%.

(b) Complete divestment of Religare Health Trust. This is a "special situation" component of my portfolio, but I think there is a few headwinds ahead. RHT brought home a 9.7% return.

***
 A typical value investing portfolio looks like some this:
i) general cheap stocks-- these stocks are typically bread-and-butter of your portfolio, and are expected to bring about most gains. However, they are likely affected by general market direction.
ii) special situation stocks-- these are stocks that moves without regard to general market sentiments. Gains are likely to be lesser, but they provide some kind of stability in a bearish market. Assessing how likely the deal will work out is the key here. The attractiveness of investing in such deals is a rough time line where annualized gains can be worked out.
***

I have since invested part of the sum from RHT's divestment on another idea. I hope to allocate more capital to this idea as I think this stock is reasonably cheap and the company's cash return is very satisfying. I will talk more about this company once I acquire a decent size amount of shares.

(c) Complete divestment of Perfect Shape, at about 40% as well. The annual report fail to explain why there is a growing amount of trade receivables. Funnily enough, the market is clearly not bothered about it and the stock went up significantly. Had I hold on to my stock, I would have my first ever 100% return from a stock. But holding on to it is not rational; the TR is no longer my problem but someone else.

(d) Increase in position of Innotek. For the CEO to double his positions at 40 cents a share, I thought getting a few stock at 36 cents is not a bad idea, and that was what I did yesterday. My luck seems incredible as I wake up to news today that Innotek has improved its latest quarter earnings dramatically. Stock closes at 42 cents, up 13.51%. Again, I take no credit for luck.

I must mention that this stock at one point bore unrealized profits of well over 50%, but I held on as I thought it is still too cheap. The stock corrected significantly after a poor quarter (typical market reaction that offer opportunities to the patient investor), to under 10% profit. This is stomach-wrenching volatility that a value investor have to endure at times.

There are still more than a couple of laggards in my portfolio-- laggards which will be favorably priced by the market sooner or later, I hope...


Friday, July 13, 2018

Portfolio Commentaries, 3 weeks into Q3


Since the last portfolio-related post on 20-June, nothing has changed. The market continues to experience draw-downs in prices. Tariffs were threatened, between United States and internationally. It is not my policy to invest based on macro trends-- I take a simpler, bottom-up approach to investing.


Year-to-date, my little portfolio returned 10.48% against -2.53% for STI. This is due to one of the best, single-day returns today.

There were only 4 significant transactions done since the last update:
1) First investment into Hop Fung group, which is incredibly cheap by book value. I didn't find this stock, I credit this to my mate who found it.

2) Slight increase in Religare Health Trust (RHT) after auditors sound off a going-concern matter. I believe the Fortis privatisation deal should be either done or that RHT could refinance. The market was very concern, going from 0.77 to 0.71. I bought a few more at 0.735 (didn't saw 0.71 coming).

IHH and Fortis sealed the deal today and RHT went up 4% on news. I suppose we should see further movement in 2 months. I might just reallocate capital to another idea.


3) Liquidation of Perfect Shape. There are still trade receivable concerns that goes unaddressed by the Investor Relations. Overall I am glad to get a 40% gain off in less than 2 months.

However, I would not have sold if not for the issue of the receivables. I was quite confident I found a growth stock at a bargain price, but the earnings were questionable, at least for me.

4) Purchase of Wheelock Properties, as espoused in the previous post.  It was a very small position that went up over 6% today. I have no idea what is going on. Perhaps the market agreed with me for once.

Monday, July 9, 2018

OKP

This is going to be a morally reprehensible post.

It was just announced that OKP and LTA has mutually agreed to terminate the PIE-Tampines Expressway road viaduct contract, worth 94.6m in 2015.

OKP is a repeated safety-issue offender. The previous incident was in 2015 and they were fined $250,000.
I doubt they will be fine much more this time.


They have purchased an Aussie property for about 45m SGD and will yield, according to this article,
about 3m every year, despite a 20% vacancy. I suppose they got a pretty good deal, so this 45m is well spent.

Let's go ahead and assume that OKP will be fined 5m dollars. That will leave OKP with 87m worth of cash. That means that after deducting 48.708m worth of liabilities, there is 38.3m worth of cash, which is (based on 308,430,594 shares) 0.124 worth of cash per share.

There is also a 27m worth of receivables. Let's go ahead and take a 30% discount off that. This is worth about $0.06 a share. The undiscounted value of its receivables is 0.0875 a share.

OKP last closed at 0.295 per share. While this announcement sounds terrible, OKP does not have to pay for any demolition. The article claims that "...The replacement contractor will be responsible for completing the construction of the viaduct, including the demolition of any structures deemed unsafe." This means that OKP is not on the hook for any more things other than legal repercussions.

Given its grassroots leader links, I estimate that it will at most take them 5 years for the public to forget about this disaster, and that they will start getting projects again. Given the strength of its balance sheet, it is unlikely to go bankrupt. Heck, they might even just rename the company, delist, etc....

With the legal issue, headwinds in the property sector from government-initiated cooling measures, and possible temporary loss of management/leadership, the company will look ridiculously cheap if it get sold down to the low 0.2x a share.

The ugly side of capitalism and stock picking.

Saturday, July 7, 2018

Commentary on the Property/Developers crash on Friday, 6-July-2018

My idea of investing is that the thesis should be as simple as possible. If the idea cannot be expressed within the confines of an A5-sized notepad, it is probably too complicated or difficult.

Let's start with APAC Realty (APAC).
The stock price on Thursday (referred from now as "pre-crash") is $0.83. It closed at $0.58 on Friday.

Let's value APAC on earnings; it has a sizable amount of good will in its books, making it unsuitable to be priced on assets.

According to its annual report, the net income of APAC looks something like this:
According to the AR, APAC has 355,197,700 or 355.1977m shares outstanding.
 
355 2014 2015 2016 2017 Average
Net Income (million) 12.2 8.5 15.9 25.9 15.625
Earnings per share 0.034347 0.02393 0.044764 0.072917 0.0439896
PE (based on $0.83) 24.17 34.68 18.54 11.38 18.87
PE (based on $0.58) 16.89 24.24 12.96 7.95 13.18
Hence, based on the bad year (lowest earnings) of 2015, the PE is 24.24 on today's price, and the best year (last), it was 7.95. Clearly the market does not believe future prospects to be warming. The average PE of APAC, based on only 4 years, is 13.18. I wouldn't say that the market has priced the company to "stupid-low" levels.

What can I learn from this episode? First, valuation based on earnings is fraught with danger. Many accounts of insiders in the oil-and-gas industry, who tried to time stock purchases during the last few years, were surprised by the protracted depression of the industry (and oil prices). The property market is a cyclical one.

Second, there is no way one could have accounted for the cooling measures.

Third, do not invest in companies during good times.

It is far safer to invest with companies whose immediate prospects are depressing, but possesses well-fortified balance sheets. One is not an optimist by parking their cash alongside companies with well-heeled futures; it is far better to be a realist than an optimist.


I am not vested in APAC Realty/Propnex.
***

Which bring us to the next company in question, Wheelock Properties (M35 in SGX). I did not come up with this idea-- this idea was brought to me by a senior value investor.


Wheelock fell about 6% during the crash. Let's take a look at its balance sheet during the last quarterly report. The net asset value (NAV) is stated at $2.68 a share, representing a 30 percent discount.


Some points to take note:
  • It has 1196.559876m shares, giving Wheelock a market cap of 1.878B or so.
  • Equity growth is at a CAGR of 4.3% for the last 10 years.
  • A dividend of 71.794m has been paid for every of the last 10 years. It has no problems paying this out of its estimated reserves, or cash hoard, for the foreseeable future.
  • At the closing price of $1.57, it represents a dividend yield of close to 3.9%.
  • The company has next-to-no debts.
  • It has 918.08m of cash. On the non-current assets, it has a further 423m worth of investments for sale. This presents $1.12 worth of liquid assets per share, leaving $0.45 for its properties for sale and rental. 
  • Most of their development properties are sold-- the remaining 20 units of Scott Square properties are freehold and currently leased out.

While earnings and cashflow are not on the steady side, a level-headed (Graham's phrase) appraisal suggest that this company is likely a much, much safer investment than others.

I am vested and will add on further weakness.

I will leave you with the beautiful writings of Graham in his book "The Intelligent Investor." As written in chapter 14, "Stock Selection for the Defensive Investor,":

"
...
Nevertheless,  the  future  itself  can  be approached in two different ways, which may be called the way of prediction (or projection) and the way of protection.
....
By  contrast,  those  who  emphasize  protection  are  always  especially  concerned  with  the  price  of  the  issue  at  the  time  of  study. Their main effort is to assure themselves of a substantial margin of indicated  present  value  above  the  market  price—which  margin could  absorb  unfavorable  developments  in  the  future.  Generally speaking, therefore, it is not so necessary for them to be enthusiastic over the company’s long-run prospects as it is to be reasonably confident that the enterprise will get along.
"

Friday, June 29, 2018

Prospecting from the "Dustbin"

One popular way of searching for value is to sleeve through the "dustbin"... namely the 52-weeks low stocks.

I have such a readily made screener in www.stocks.cafe. Parameters used are illustrated below:
I would explain some of the terms above for users unfamiliar to the stocks.cafe platform. "Close% from 52-weeks Low" is expressed as a percentage. Any stock's last closing price that is within 3% from the lowest in the last 52 weeks will appears in the results.

"Price/ Tangible Book" refers to the closing price divided by the book value, minus any "soft" items like goodwill, land rights, etc. It isn't that they do not have value... it is just hard to determine. The prudent value investors tend to ascribe a value of 0 to it. Now I will say this screener might not work too well on this, so you need to double check the annual reports for the prospect. I don't have any hard and fast rules about book value, but anything within 3 or so is still reasonable. I intend to write  another post regarding the book value investing approach later.

Debt/Equity is expressed as a number. If the figure is 0.3, it means that for every 1 dollar of assets, there is 30 cents worth of debt. Ideally this should be interest-bearing debt-- trade payables are usually not interest-bearing and should not be accounted as debt.

"Last Close > 0.1" is a personal choice-- I do not want to look at any penny stocks in SGX. These stocks are prompt to consolidation in the future. For the uninitiated, SGX has this weird rule that stock prices must meet the Minimum Trading Price of > 0.20 in X amount of years; stocks are traded in 100 units minimum in Singapore.

Since my capital is small, I will gladly forfeit some quality penny stocks.

EV/ EBIT_operating_income > 0 is a funny one. It basically means Enterprise Value (EV), which is Market Cap (all stocks multiply by market price) + Debt - Cash.

There are a couple of ways this can be negative. First, the company might have more cash than debt and market cap combined. These are the ultimate value stocks. Since I forced the screener for give me a positive value, this means I would miss such stocks. There is nothing to stop me from creating another screener to look for these value stocks The other reason why it will be a negative number, is that EBIT is negative (company is making a loss).

EBIT_operating_income is not a choice I preferred, but the only one that is available. For the uninitiated, this refers to profit that is available after all costs, except tax and finance cost (which is interest charges from borrowing), is levied. The whole idea is to evaluate companies from an equal footing.

Current Yield > 0 is the current dividend yield in percentage. A dividend must be present. You will need to wait for dustbin stocks to recover and I want to be paid for it.

***

 Running this screener for just SGX this week, I have the following:
The data is copied and pasted into Microsoft Excel for easier viewing. I added a column call Price/FCF. A company which has unsteady cash flows will have a very high or low number... this is just for my viewing pleasure.

The next step is to cut away all stocks that:
Do not offer a dividend consistently for years. Capitaland has been offering increasing dividends over the years, which is delightful.

Large debts; a very high D/E (debt/equity) number-- unless this is a relatively big company. As silly as this sounds, banks do give institutions a bigger leeway. For the smaller companies, they are removed. This is not to say that they aren't good stocks-- I just want to sleep better at night.

The next step is to look at each and individual companies from stocks.cafe. There is an advantage here presented by Stock.Cafe, an extract of the Profile tab of YZJ Shipbuilding as follows:
First of all, the book value must improve over the years. Book value has increased 0.698 to 1.389. Whether this book value is reliable... let's just say we will check that later.

More of an interest to me is the earnings, and free cash flow per share diluted. I want to see positive numbers in free cash flows. Most companies are capital intensive, which means for every dollar earned, a large amount of it is re-invested into the company for both maintenance and growth.

I want to say something about growth-- a growth in earnings per share is not necessary a sign of growth. It is merely a hint of growth, and the company's ROIC should be investigated. An EPS growth of 10% that results from a substantial increase in invested capital is not growth. 

I have digressed-- let's get back to screening stocks.

Companies that have less than desired reputation are also removed.The net result is 7 companies for further investigation, out of a starting of 26. This is just the first step. I would not be surprised if none of them make the cut at the end of the day.

If you do dustbin-picking very frequently, you will recognize names that appear time and again. Reputed value investors (like John Neff) advocate paying more attention to new stocks that appear in the list. My personal opinion is that the market is usually efficient-- so long term, they can't be that wrong.
Thursday, June 28, 2018

Perfect Shape: Unaudited Full Year Earnings Released

Perfect Shape (1830, HKEX) full year results were signed off and released hours ago. Do refer to my  earlier post on buying Perfect Shape,

Actual revenue turns out to be 900+m, an increase of about 150m. The cost of goods sold did not increase much as accordingly. This trickled down to an increase of net profit to 194.187m over 91.356m last year. Perhaps this business is really as efficient as it looks.

Net margin, without considering non-business-operations gain, is now 21.4%. This leapfrogs last year's 12%. However, trade receivables remain worrying. One can only take the words of the management, which I quote:

"There  is  no  concentration  of  credit  risk  with  respect  to  trade  receivables  as  there  are  a  dispersed number  of  financial  institutions  with  high  individual  credit  ratings  through  which  the  credit  card and  installment (sic)  sales  arrangements  are  entered  into."

The company decided to distribute 15.1 cents of dividend, in view of the company's 15th anniversary. I did not foresee this. The yield would be about 10% given today's closing price.

Diluted EPS is 17.9 cents. Given a PE of 10, the company is worth about 1.79 HKD. This is roughly inline with my estimate.


***

Cash and equivalents is 395.761m
Market Cap is now 1.63B, or specifically, 1635.607200m
Enterprise Value is 1239.8462m
Net Profit is 194,187.
Adjusted Earnings Per Share is  6.4 times and the (conservative) acquirer multiple is 6.384 times. If we were to use EBIT instead, it will be 4.86 times. This company is really, really cheap.


*I have liquidated my current positions at 1.79 HKD, in view of the mounting trade receivables. I was unable to get a response from Investor Relations despite sending emails*

Sunday, June 24, 2018

A Statistical Look at Our Big Three Telcos

Using very simple statistics, I have a few opinions about the current predicament of telcos. Stats are compared with closing market prices on 22-June.

Without considering into the qualitative aspects of our three listed entities:
(a) M1 has a cash yield of about the 7.12%. This means as a business owner, can look forward to a cash return of 7% after buying over the company as whole. This is simply cash flow from last reported year over market cap.

On an average of 10 years, this cash yield is 8.77%. Unlike Starhub, M1 management did not indicate a dividend payout in absolute or percentage terms (correct me if I am wrong, I am not a keen follower). So M1 has a distinct advantage.

Gross Margin has fallen in the last 10 years, from 23.94% to 15.97% (CAGR: -3.96%)
Net Margin has fallen from 18.75% to 12.78% (CAGR: -3.76%)

(b) Starhub has a cash yield of 7.79% based on last year's return.Given its precipitous fall over the last few weeks (and surprising 2% uptick on Friday), perhaps market is tagging it as a bargain.

The cash yield over 10 years average data is 11.79%.
However, Starhub has pledged to give 16 cents a share last year... I don't have any idea if the management will comes to their senses soon.

Gross Margin has fallen in the last 10 years from 19.24% to 15.12%. (CAGR: -2.38%).
Net Margin has fallen from 14.63% to 9.87% (CAGR: -3.86%)

(c) Big brother Singtel has a cash yield of 7.08% (from 2018 AR figures). While this sounds attractive given the dividend strength (in terms of cash flow), Singtel would probably struggle to pay if free cash flow falls below 2.857B. The average over the last 11 years is 2899B or so.

On an average of 11 years, Singtel's cash yield is 6.72%.

Gross Margin has fallen (less drastically so) from 29.99% to 27.55%.
Net Margin from 26.68% to 16.19% (CAGR:  -4.44%). This net margin drop looks drastic because I excluded the divestment from Netlink Trust, which is non-recurring. With it, the net margin is 27.25% (CAGR: 0.19%).

My opinions
(i) If Starhub have a more sensible dividend payout, it is a better buy given the cash yield of 7.79%. Unfortunately, a downward adjustment of dividends is likely to be succeeded by a downward adjustment in prices... this makes market timing close to impossible.

While it is the cheapest, it isn't that much cheaper. Take note: Starhub have the worst gross margin drop, as well as the worst net margin.

(ii) Singtel's gross margin over the years suggest they have the most capable management among the three. The lack of special dividends from divestment is understandable, and not because it was stingy. Stop wishing for the special dividends.

(iii) There is little difference between Singtel and M1's cash yield, meaning they are almost as cheap as each other! But it is only for the past year.

*****

Trade carefully, and do note that there are...... more than just these 3 companies in SGX, and there are more than just SGX in the world.

Wednesday, June 20, 2018

Portfolio Updates, 2nd Quarter 2018

The Singapore market nose-dived since 11-June, from 3.2% to -1.15%. The HSI returned -1.51% year-to-date. It was pretty merciless.

Investors who said hello to Valuetronics, AEM and other popular tech sectors recently would see their eggs royally smashed.

The proposed tariffs brought about by Trump on China and the latter's counter-measures sunk the HKEX market pretty bad yesterday. HSI closed at -2.7%.

Two of my stocks, Perfect Shape (PS) and Xing Hua Port Holdings (XHP), were down by almost 5% and 7% intra-day respectively. It was a pretty sad sight but I am not affected because it wasn't because my stock picking has failed me.

There were no issues with the companies behind the stock.

Current returns stayed at 9.19%, which means I am about 10% better than both markets, which is highly satisfactory given my limited ability.

PS remains the biggest position in my little portfolio. Earnings will be released next week. I expect the market to price this company in pretty volatile fashion.

RHT Health Trust's fate is intertwined with Fortis, which is still in the midst of getting its financial statements and buy-out (of RHT) sorted. Eventually the deal should be realized. In view of the risk, this arbitrage is my second biggest position. Usually I would put in quite a bit of money in merger deals, but there is a slight risk here. As long as there is value in RHT, there shouldn't be cause to worry. Sure, the price will plunge should the deal falls through, but the value will still be there.

XHP is pure bad news but I do not believe the odds are poor for the next 3 years. Meanwhile the wait is compensated by a decent 4% dividend.I am currently looking at a -8% loss and will average down when it hits 15-20%.

XHP is a bit of a shame since I was staring at a 60% return, just like Innotek (currently at 16% or so). I guess that is the price to pay when you do not want to listen to the market.

There are a handful other stocks which has not hit its potential yet. The portfolio is currently diversified across 10 companies. No radical approach will be adopted-- I shall stick to picking stocks on value.

May 2026 Portfolio Update

Both S&P and STI is about 10% at the moment, while HSI is looking at about negative 1%. This year is not a great year... I am on 4% at t...